Azure Dashboards: They need to get better
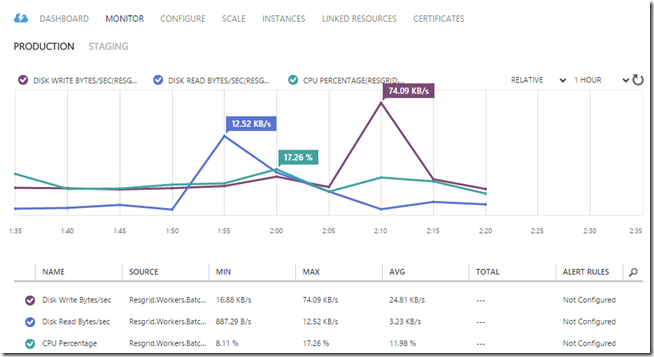
I’ve never really taken the Azure Dashboards seriously, or the Metrics page really. For the uninitiated the Dashboard and Metrics pages inside Azure are views into your Cloud Service, VM, Web App, etc. They give you some key metrics about the resource utilization or performance of your service.
Great right, well personally I’ve always felt it as an incomplete picture. For example on Cloud Services I can’t get Memory Utilization, really Azure no memory utilization? It’s also relative to all the items in the chat, so a chart with 5% may be toward the top if none of the other elements push the max value much higher. This is configurable, instead of using Relative you can use Absolute. But that’s pretty useless if your mixing metrics, for example if you have Disk Read Bytes and it’s 500 it’ll push the chat to 500 and your 50% CPU utilization will be at the bottom.
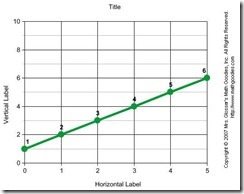
But one important metric CPU utilizing is something I needed to pay more attention to. You can’t track history out more then 7 days which is rough. But if you can eye-ball it you can get a general feel. For example Resgrid has a Cloud Service Worker Role, if I had to extrapolate it’s CPU graph over 2 years it’d look like this:
If you have resource utilization increasing over time in a linear fashion like this it’s your metrics shouting “Huston you may have a problem”.
In our case there were some data points that could have been causing the issues. As our customers use the system our data footprint grows, new calls, new actions, new staffing levels, etc.
Every month our worker process would utilize a little more CPU. After a little bit a work and little RedGate ANTS profiling we narrowed down, when we were auto-closing calls we were pull all calls (Closed, Cancelled, Unfounded and Active calls) instead of just active ones.
So some slight tweaking we got to here:
This is what success looks like, from ~47% CPU utilization to around 15%. PROTIP for Worker Roles don’t let them get past 50% utilization, Azure will just assume there are failing and it will constantly restart it.
The Azure Dashboard and Metrics screens need to give you more then just 7 days, 7 days isn’t enough to establish trends, they also need to give you memory utilization. Hopefully the new Azure Portal will help with some of this and hopefully Microsoft will give Cloud Services some love.
Resgrid is a SaaS product utilizing Microsoft Azure, providing logistics, management and communication tools to first responder organizations like volunteer fire departments, career fire departments, EMS, search and rescue, CERT, public safety, disaster relief organizations, etc. It was founded in late 2012 by myself and Jason Jarrett (staxmanade).


